
You know the feeling. You click a link, full of anticipation, and then… nothing. The screen just hangs there, shimmering with the promise of information, but delivering only a slow, agonizing blank white void. You wait. Five seconds pass. You’re already gone. You hit the back button and go find a site that respects your time.
Honestly, this part trips people up all the time. They spend weeks crafting the perfect content, optimizing for 100 keywords, and buying expensive ads, only to lose the customer in the final, frustrating seconds.
Here’s the thing about SEO in 2026. It’s no longer just about backlinks and keywords. It’s about usability. And when it comes to usability, speed isn’t a nice-to-have feature. It’s the entire foundation. If your site is slow, your perfectly optimized content might as well not exist.
Ready to see how quickly a slow site can empty your wallet? Let’s dive into the cold, hard numbers.
The Cold, Hard Truth: How Speed Becomes Sales (The “1-Second Rule”)
Let me start with a quick story. I was looking for a new pair of headphones the other day. Clicked on a recommended site, and it was agonizingly slow. I sat there watching the little spinning wheel, feeling my morning buzz fade. Did I wait? Nope. I went to a site that loaded instantly. They lost a sale because of a few hundred milliseconds.
The Cost of Waiting
That feeling of frustration I just described isn’t just me being impatient, it’s a universal psychological trigger. When a site doesn’t load instantly, we feel dismissed. We feel like the company doesn’t care about our experience.
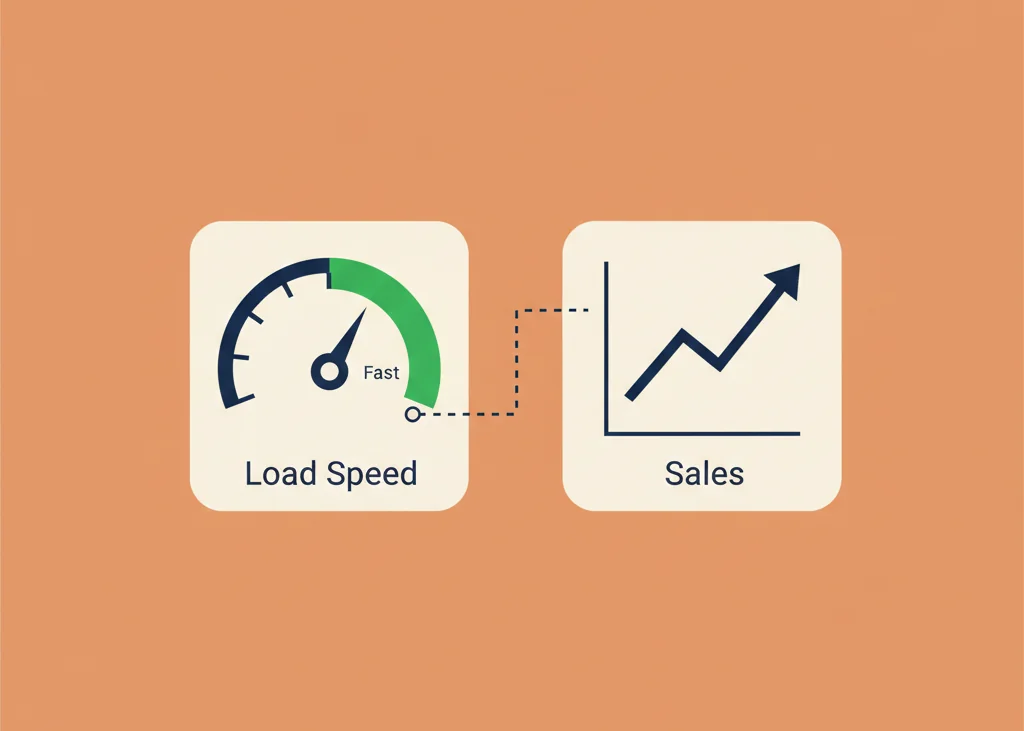
Here’s the big reveal that should make your stomach drop: According to countless studies, a one-second delay in page response can result in a 7% reduction in conversions.
Think about that. If your e-commerce site makes $50,000 a day, that 7% dip is $3,500 gone. Every. Single. Day. You can’t afford to just shrug that off. Amazon knows this. They famously found that every 100 milliseconds of latency cost them 1% in sales, which is why they invest so much in lightning-fast infrastructure.
Key Takeaway: Speed isn’t just a technical metric, it’s a direct financial metric, a crucial component of Conversion Rate Optimization (CRO). You’re not optimizing code for Google, you’re optimizing it for your bank account.
Defining Page Speed: What Google Actually Measures
When people talk about “page speed,” they often just mean the total page load time. That’s too simplistic. Google doesn’t measure the finish line, it measures the whole race, focusing on when the user can see and interact with your site.
- Page Load Time vs. Site Speed:
- Page Load Time is how quickly a single page loads for a user.
- Site Speed is the average page load time across a sample of pages on your website. Google looks at the overall health, not just one golden homepage.
Here’s where it gets interesting. You need to focus on these key user-centric metrics, which are the ones driving your search rankings now:
- Time to First Byte (TTFB): How long it takes your browser to receive the first piece of data from your server after a request. High TTFB usually signals a slow server or poor database optimization.
- First Contentful Paint (FCP): The moment any part of the page’s content appears on the screen. This is crucial for perceived speed. A good FCP score tells the user, “Something is happening, don’t leave.”
- Time to Interactive (TTI): The point when the page is visually rendered and the majority of elements are functional and can respond to user input. This is where the user can actually use the page.
I might be wrong, but most people start with FCP and stop there. You can’t. You need to hit all three marks.
Why Speed Is a Critical SEO Ranking Factor (Core Web Vitals Explained)

The Genesis: Speed as a Confirmed Ranking Signal
Google has been telling us to speed up for over a decade. They announced the Speed Update in 2010 for desktop searches. Then, in 2018, they made it official for mobile with the Mobile Speed Update. These were the first official warnings.
The big shift came in 2021 with the Page Experience Update. This is when speed transitioned from being a factor to being an essential part of the ranking system. Google is now measuring your site against a baseline of acceptable user experience, and if you fall below it, you’re playing on hard mode.
Mastering Core Web Vitals (CWV): The Modern Speed Standard
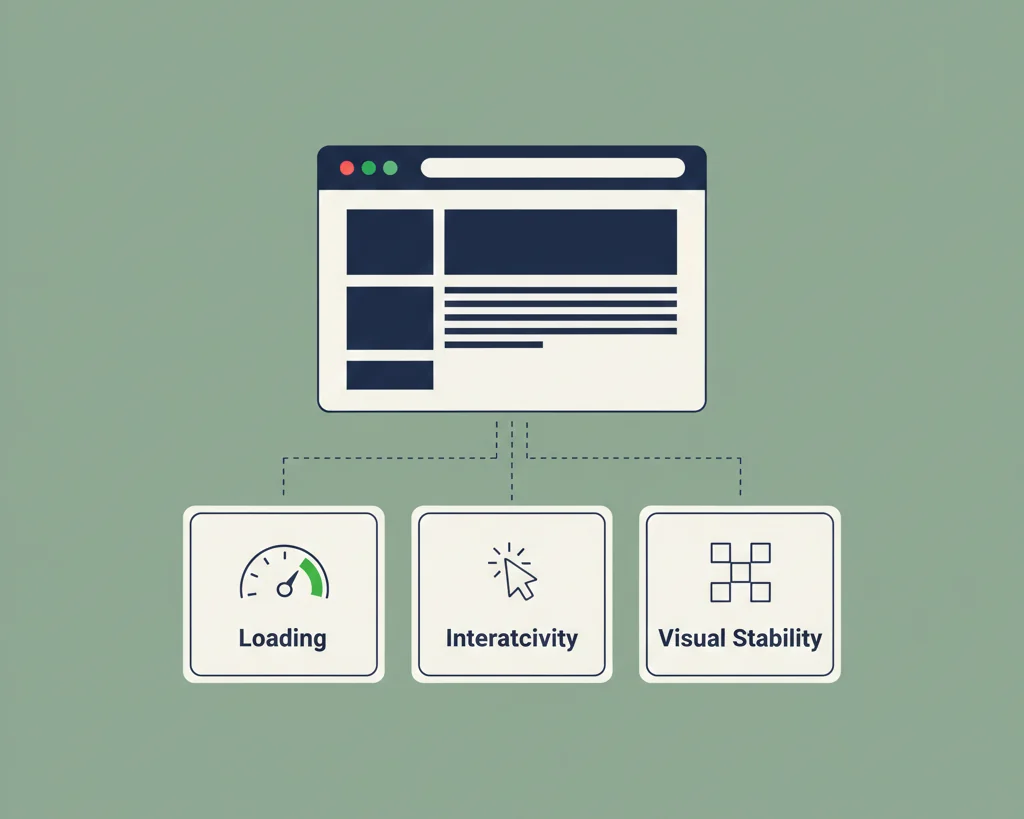
The Core Web Vitals are the holy trinity of user experience metrics. If you’re not tracking these three numbers, you don’t have an SEO strategy, honestly.
- Largest Contentful Paint (LCP): This measures the time it takes for the largest image or text block in the viewport to load. This is the main content, the thing the user actually came to see.
- Target: You need to hit $\le 2.5$ seconds for the top 75% of page loads.
- Interaction to Next Paint (INP): This measures the latency of all user interactions (clicks, taps, keypresses) on a page. It’s all about responsiveness. Is your site sluggish when someone tries to open a menu or fill out a form? This metric catches that. (It is replacing the older First Input Delay (FID) as the responsiveness metric.)
- Cumulative Layout Shift (CLS): This measures visual stability. It calculates how much the visible content shifts around during the page load. Think about clicking a button only to have an ad load at the last second and push the button out of the way. That’s bad CLS.
- Target: You need a score of $\le 0.1$.
The Google Standard for these is broken down into three buckets, which you see right in your Search Console: “Good,” “Needs Improvement,” and “Poor.” If you have a lot of “Poor” URLs, you’ve got a serious problem that is actively depressing your rankings.
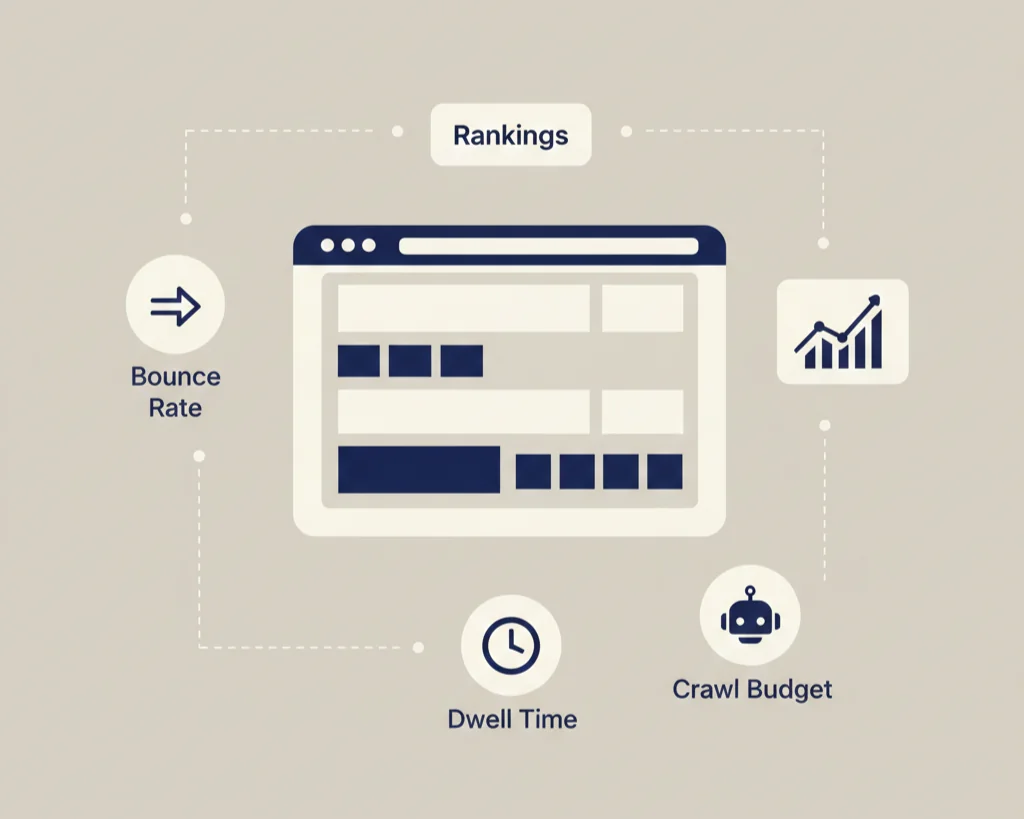
The Indirect SEO Impact: Bounce Rate, Dwell Time, and Crawl Budget
Even if speed wasn’t a direct ranking factor, it would still impact SEO because of the way users behave.
- Bounce Rate Skyrockets: Data from countless sources, including a famous KISSmetrics infographic, shows a clear correlation. If your load time jumps from 1 second to 3 seconds, your bounce rate increases by over 32%. Push it to 5 seconds, and your bounce rate can climb to 90%. You pay for the traffic (or rank for it), and the customer just leaves. That’s a silent killer.
- Dwell Time: Fast sites encourage deeper engagement. The user clicks more pages, spends more time reading your content, and this signals to Google that you delivered a valuable experience. A fast site gives the user time to actually read your content, increasing dwell time.
- Crawl Budget Efficiency: Now for the part most people skip. For very large sites (think thousands of pages), a slow site wastes Googlebot’s time. If your server takes too long to respond (high TTFB), Google can’t crawl as many pages in the time it has allocated. This means your new content, or even important updates, won’t get indexed as quickly, hindering your indexation.
The Direct Impact on Sales & User Experience (UX)
The Conversion Killer: Statistics That Prove Speed = Money
Let’s circle back to the money. The 7% conversion drop per second of delay isn’t theoretical, it’s been proven over and over again in the real world.
- Walmart reported that improving load time by 1 second resulted in a 2% increase in conversions.
- Mobify saw a 1.11% increase in conversion rate for every 100 milliseconds of improvement in their homepage load time.
The psychological factor here is all about Instant Gratification. We are wired for immediacy. When a brand delivers speed, it builds immediate trust. A slow site feels old, untrustworthy, and unprofessional, even if the content is stellar. It’s brand confidence 101.
The Mobile-First Imperative
This one should be obvious, but it’s still the biggest mistake I see. Your Core Web Vitals are measured on mobile first. Why? Because over half of global web traffic is now mobile, and mobile connections are inherently less stable than desktop broadband.
Think about someone on a crummy 3G connection waiting for your site to load. According to Google, 53% of mobile users abandon a site that takes longer than 3 seconds to load. This isn’t an option anymore. If your mobile performance is bad, your entire SEO and revenue strategy is broken.
Bounce Rate: Your Silent Budget Killer
If you’re running any paid campaigns (PPC on Google, Facebook Ads, etc.), a high bounce rate isn’t just a bad SEO metric, it’s you literally taking hundred-dollar bills and setting them on fire. You pay for the click, the slow site chases the visitor away, and the ad budget is wasted. The better your speed, the higher the ROI on every single dollar you spend acquiring traffic.
The Expert’s 7-Step Page Speed Optimization Blueprint
This is where I’d probably mess this up if I rushed. Speed optimization can feel like a complicated mess of code, but if you approach it systematically, you can make huge gains.
Step 1: Fix Your Foundation (Server & Hosting)
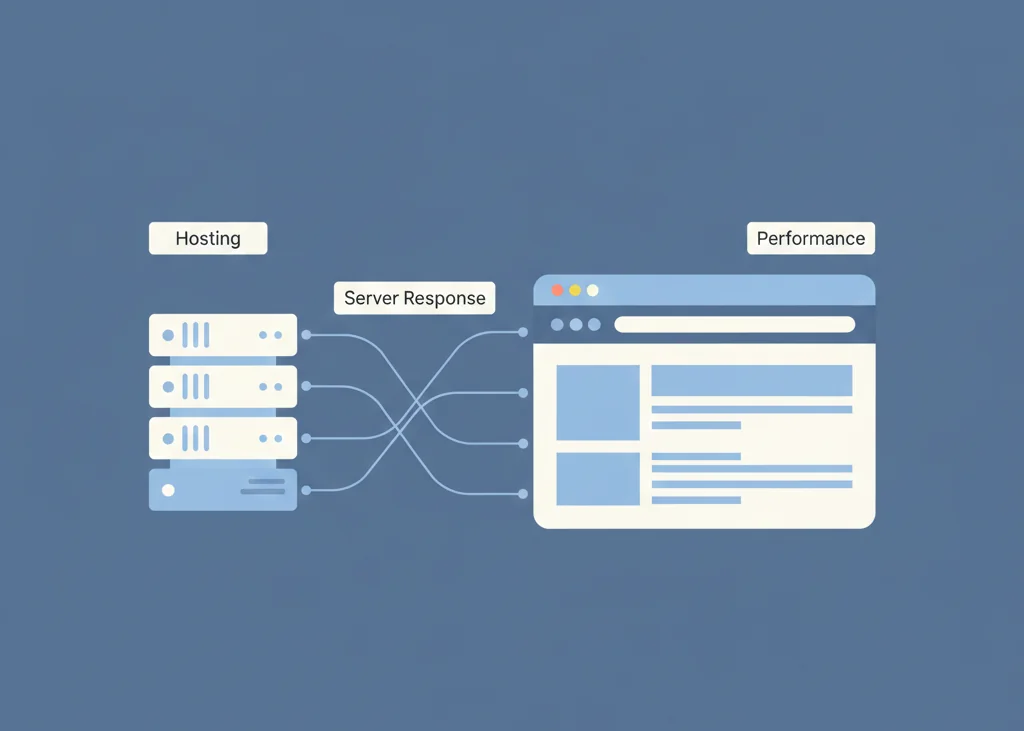
Here’s the plain truth: Bad hosting is the anchor dragging your site down. No amount of code optimization can fix a garbage server.
- Time to First Byte (TTFB) Optimization: TTFB is heavily dependent on your server. If your server response time is over 500ms, you have a foundation issue.
- Upgrade to Better Hosting: Stop using shared hosting if your traffic is significant. Move to a Virtual Private Server (VPS), dedicated hosting, or managed Cloud Hosting (like Kinsta or WP Engine for WordPress). It costs more, but it pays for itself in conversions.
- Optimize Database Queries: Especially for dynamic sites like WordPress, slow database calls can tank your TTFB. You’ll need to clean up old plugins, delete post revisions, and ensure your database is running smoothly.
Step 2: The Biggest Culprit: Image Optimization

Oversized, uncompressed images are the number one mistake I see. They account for over half of a typical page’s weight.
- Compression: Use tools like TinyPNG or the Imagify plugin to reduce the file size without noticeable loss of quality.
- Format: Convert your images to WebP. This modern format offers superior compression (often 25-35% smaller than JPEG) with no quality loss. It’s the current standard.
- Lazy Loading: Only load images when the user scrolls them into the viewport. This is essential for a good LCP score, as the browser only has to load the content above the fold first.
- Serving Images at the Right Size: Never upload a 4000-pixel wide photo and then use CSS to shrink it down to 400 pixels. That forces the browser to download a huge file and then waste resources resizing it. Use correctly sized image versions.
Step 3: Streamlining Code (Minification & Compression)
Your site’s code (HTML, CSS, JavaScript) is full of comments, white space, and extra characters that humans need but computers don’t.
- Minify HTML, CSS, and JavaScript: Use a tool to strip out all that unnecessary stuff. This reduces file size, making the files transfer faster.
- Enable Gzip or Brotli Compression: This happens at the server level. It’s like zipping a folder before emailing it. Brotli is the modern, superior compression algorithm, but Gzip is still widely used and necessary.
- Remove or Defer Render-Blocking Resources: CSS and JavaScript often have to load completely before the browser can render the page. This is a huge hit to FCP. You need to identify the critical CSS needed for the visible portion of the page and load everything else later (defer or asynchronously).
Step 4: Leveraging Caching & CDNs
Here’s the tricky part. For most visitors, you don’t want your server to do any work.
- Browser Caching: Tell the user’s browser to store static elements (logos, CSS files, etc.) locally. When they revisit your site, the browser doesn’t have to download them again. This is essential for repeat visitors.
- Content Delivery Network (CDN): A CDN (like Cloudflare, Akamai, or BunnyCDN) is non-negotiable for global audiences. It copies your site’s static files to servers all over the world. If a user in London visits your site hosted in New York, the CDN serves the files from a server in London. This dramatically reduces latency and improves TTFB.
Step 5: Taming Third-Party Scripts and Bloat

This is where you lose a lot of speed. We love our analytics, ad networks, chat widgets, heat map trackers, and all the other goodies. But they can slow you down massively.
- Identifying and Reducing the Impact: Run a speed test (like WebPageTest) and look at the “waterfall view” to see which third-party script is the slowest.
- Prioritizing Scripts: Load non-essential scripts asynchronously or deferred. If a live chat widget loads 5 seconds after the page, nobody cares. If your main content loads 5 seconds after the chat widget, everyone leaves.
Step 6: Font Optimization
Fonts seem innocent, but they can hurt LCP and FCP.
- Using System Fonts: The fastest option is a system font that is already on the user’s computer.
- Preloading Key Font Files: If you must use a custom font, tell the browser to prioritize the key font files you need for above-the-fold content using a <link rel=”preload”> tag.
Step 7: Continuous Monitoring and Improvement
You don’t optimize a site once and call it a day. My previous experience has shown that something always breaks or slows down. A new plugin, a heavy image in a new blog post, a server update.
- Regularly Running Diagnostics: Run a check-up weekly or monthly. Set up alerts on your monitoring tools.
- Track Performance: Don’t just look at the speed score, monitor your conversions and bounce rate. You are optimizing for revenue, remember?
Tools of the Trade: How to Audit and Monitor Your Speed
You can’t fix what you can’t measure. These are the tools the pros use.
The Essential Diagnostic Tools
- Google PageSpeed Insights: This is your starting point. It provides two crucial types of data:
- Field Data (CrUX): Real-world user data collected over the last 28 days. This is what Google uses for ranking.
- Lab Data (Lighthouse): A simulation of your page speed in a controlled environment. Great for debugging changes right now.
- Google Search Console (Core Web Vitals Report): This is your best friend. It identifies every URL on your site that falls into the “Poor” or “Needs Improvement” CWV categories. This lets you fix the problem pages at scale.
- GTmetrix and WebPageTest: These are for deep-dive analysis. Their Waterfall view is priceless because it shows you exactly when every single file (image, script, CSS) loads and how long it takes. This is how you identify the exact bottleneck.
Setting Your Speed Benchmarks
What is the ideal load time in 2026? Honestly, aim for $\le 2$ seconds for a full load, but more importantly, you must hit a “Good” status across the board for all Core Web Vitals.
How to monitor conversions post-optimization? Track two things in Google Analytics:
- Bounce Rate/Exit Rate on your money pages.
- Your Conversion Rate.
A speed improvement that doesn’t move these needles isn’t a good speed improvement.
Frequently Asked Questions (FAQ)
Is page speed more important than content quality?
Honestly, no. Content quality is the top of the pyramid. If you have slow content, no one reads it. If you have fast garbage, people leave instantly. They are mutually dependent. Fast content is usable content, and usable content can rank. You need both.
What is the most common page speed mistake I can fix today?
Oversized, uncompressed images. Go to your five most important blog posts, run them through PageSpeed Insights, and look at the “Serve images in next-gen formats” and “Efficiently encode images” warnings. That’s usually a quick, high-impact fix.
Does the PageSpeed Insights Score directly affect my ranking?
Not directly. You won’t rank higher just because you got a perfect 100 on the score. The score is a proxy for performance. The underlying Core Web Vitals metrics (LCP, INP, CLS) are the actual ranking factors. Focus on fixing the warnings, not just painting the score green.
The Final Verdict: Prioritize Speed, Drive Revenue
We’ve seen the numbers. We’ve looked at the case studies. We’ve broken down the seven steps.
Stop thinking of page speed as a chore for your developer or a tedious box to check for Google. It is a revenue metric. It’s the gatekeeper of your sales funnel. A slow site is a leaky bucket, and you’re pouring your hard-earned traffic, your great content, and your marketing budget right through the holes.
Don’t just chase a green score, chase a faster experience that turns visitors into buyers. Your bottom line will thank you for it.
